#
Rigs, curves, and targets
The following section is dedicated to explaining and detailing the different FR curves that are prominent nowadays, as well as the different measurement rigs and standards that are being used. Preference target curves by reviewers will be mostly ignored as they are usually based entirely on subjective preference.
#
Measurement rigs and standards
Measurement rigs and systems for acoustic phenomenon have several standards they have to abide by. There are two relevant standards nowadays when it comes to IEMs: the IEC 60318 standard, and the ITU-T P.57 standard. Within these standards, there are further classifications; for the IEC 60318, the relevant ones are 60318-4 (also commonly referred to as 711, for IEC 60711 which was its predecessor) and 60318-7. The difference between the two is the presence of a head and torso simulator, with the former only detailing the ear canal's acoustic impedance. For the ITU-T P.57 standard, there are many different categories based on different pinnas and occluded ear simulators. In the context of IEMs, HATS can usually be ignored. The important rigs/systems to consider are IEC 60318-4 (711) rigs, and ITU-P.57 type 4.3 rigs.
Did Linus just waste $50,000?
#
IEC 60318-4 occluded ear simulators
IEC 60318-4 couplers, or commonly referred to as 711 couplers, have been the industry standard for a few decades, and are systems that aim to simulate the acoustic transfer impedance of the average occluded human ear canal. To do so, couplers have specified air volumes but do not simulate ear canal geometry, which results in less accurate transfer impedance in the treble region above 10 kHz, and might also impact transfer function resulting from IEM wear as mentioned previously.
These couplers only have a metallic tube where the IEM can be inserted, which affects results in various ways. The first is that coupler resonance is usually higher in frequency than what usually happens with human ear canal resonances. The second is that the metal tube does not accurately simulate possible leakage scenarios for IEMs. FRs measured with "correct" seal on these systems are therefore very ideal in terms of sealing; real sealing conditions on humans will most likely have varying levels of subtle leak, thus changing perceived low frequency response. With the -7 standard that includes a pinna, some of these issues can be mitigated in exchange for harder and more inconsistent measurements since leakage has to be accounted for much more thoroughly.
#
ITU-T P.57 Type 4.3 (B&K 4620/5128) ear simulators
ITU-T P.57 type 4.3 specifies both the pinna and the occluded ear simulator, and compliant systems for this standard are also usually compliant with IEC 60318-7. For the pinna, the ITU-T P.57 Type 3.3 pinna is used with a small change at the base for attachment purposes as well as better transfer impedance matching. The occluded ear simulator is based on a study where researchers analyzed and measured the transfer impedance of 32 subjects in order to create an anatomically correct and more accurate occluded ear canal: the important change here is the presence of ear canal geometry. This results in better transfer impedance matching to the average, more accurate canal resonance location, and other changes, of which the relevant parts are discussed in the Measurements and misinterpretation section. The most prominent compliant system is the B&K 4620/5128, where the 4620 only includes the pinna and ear simulator while the 5128 includes the head and torso simulator. ITU-T P.57 type 4.4 utilizes the same pinna as type 4.3, but instead terminates with an IEC 60318-4 coupler for the ear canal from the reference plane to DRP. The important part of this new standard is that the increased accuracy in low frequency transfer impedance should theoretically allow for direct headphone-to-IEM measurement comparisons: this is especially interesting when considering the preference research for both, where large discrepancy in bass was observed.
#
Preference target or not?
Whether or not to call an FR curve a preference target depends entirely on if said FR curve has undergone preference testing, which usually involves a sample that undergoes several "calibration" steps with one device/IEM. They are then made to listen to various audio signals, usually music with significant content throughout the audible band (ie music that has enough bass, mid range, and treble content) with different EQ presets that change the FR to various curves. The subject then rates the different presets, and the final results are analyzed.
A simple definition can be that a preference target is an FR curve that has shown to be liked significantly. FR curves that are shown to be not preferred highly, and/or are based on theoretical concepts (eg DF) are not targets per say, just FR/reference curves. The question of whether or not the term of personal preference target is actually a preference target can therefore be answered when looking at the above definition, in which case the use of the term is correct.
A preference target is an FR curve for which preference has been shown to be high, and one that is usually targeted for by either manufacturers or listeners.
#
Harman In-Ear target (711 & 5128)
The HarmanIE target has gone through three iterations (2016, 2017, 2019v2) and is a preference target made by Harman for IEMs for measurements made on IEC 60318-4 compliant systems. It is currently the "most researched" target in terms of sample size, and has been shown to be very well correlated with preference by other studies. There is however a general disagreement about it with some in the community;do remember that the community is a very thin slice of a slice of the average population.
Harman's IEM research, started indirectly in 2016 with a study on preferred bass response in IEMs, has a similar aim to their headphone target, which is to find the most preferred FR target. For headphones, the target response (Harman 2013) aimed to reproduce the same response as a a calibrated 7-channel loudspeaker system with flat on-axis anechoic response placed in a semi-reflective room, resulting in an in-room response that drops approximately 1 dB/oct from 20 Hz to 20 kHz with a bass boost around 105 Hz. To do so, a HATS was placed in a reference room and the resulting response was used. The 2016 version of HarmanIE was essentially the same as the headphone target, but with a 4 dB increase in bass levels; it was reasoned that this increase was due to occlusion-induced noise. The difference in treble is negligible.

In 2017, Harman published a two-part study that formally examined their established target against many other IEMs. They found that the target was significantly preferred over every tested IEM, for both trained and untrained listeners. To do such testing while minimizing potential biases that might arise from the physical aspects of the IEM itself (eg fit, material, size, etc), a virtualization method that was validated in another study was used, where they equalized the response of the IEM that was used to the responses of the tested IEMs and the established HarmanIE target. It is important to note that the 2017 iteration is very different from the 2016 one, mainly in the treble. The changes have only been covered briefly, and have been described as having been done with formal listening tests with both trained listeners and the three authors. The most notable differences are the elevated treble amounts, as well as the appearance of what seems to be resonances. Furthermore, the response drops off abruptly after 10 kHz due to the inherent response of the IEM, as well as high individual variation in FR at the DRP.
For the 2019v2 target, Harman has not published any publicly-available studies. It is essentially the 2017 version of the target with smoothing applied (very similar preference ratings when testing IEMs), with most fine details like the resonances and fine HRTF details being removed. It is currently the most popular version of HarmanIE, and is what is currently being used in AutoEQ. It is also the basis for many different targets and projects. For the 2017/2019v2 targets, the changes from the 2016 target are not thoroughly explained. There are two major changes: the bass shelf shape (ie Q) is different, and the level in the region from 3-8 kHz was increased. The issue that most people have with HarmanIE (usually 2019v2) can be explained by two factors: the mid bass and lower mids dip at around 250 Hz, and the elevated region from 3-8 kHz. Both of these aspects exacerbate one another, and lead to what many report as being a "thin", "overly bright" sound.

These issues are often said to be related to the methodology and reasoning behind the target, where many argue that the assumption that the headphone target would translate for IEMs is wrong. The addition of listener filter modifications should therefore be a fix for such an issue, but in the 2016 study, only the bass shelf was adjustable, which could lead to overcompensation for the rest of the FR. The changes past the 2016 target cannot be discussed, but it is reasonable to assume that the increase in the treble region was again caused by overcompensation for the bass increase in the 2016 target. As explained previously in the Measurements and misinterpretation section, the "inaccurate" acoustic impedance below 1 kHz for 711 couplers could also explain the discrepancy between the headphone and IEM targets.
Despite all of this, the HarmanIE target is still highly preferred in most listening tests done. A preliminary study using the 5128 rigs and a small group of listeners by Sean Olive also shows a high preference rating for the target after roughly compensating the target to 5128. There were however many other curves that were rated similarly high. A new HarmanIE target is currently in the works, this time with what seems to be an overhaul of the premise of headphone response being the foundation, since the 5128 system seems to allow for direct headphone-to-IEM comparisons.
A paper in 2024 examined the preference targets for IEMs on the B&K 5128. 5 targets were examined and rated by the listeners; it was found that the HarmanIE 2019 target (translated to the 5128 with corrections) and the Soundguys target were both preferred equally and above the other three targets by class 1 listeners (72%). The results show similar preference that despite the two targets having large - both in amplitude and range - differences, which the author suggests is due to "a perceptual tradeoff between bass and treble levels whereby a reduction in bass may be compensated with an equivalent reduction in treble, and vice versa". Furthermore, he also suggests that "it seems that a constant delta of 8 dB between the bass and treble
bands of the target curve can produce equivalent satisfaction and listener preferences".
Class 2 listeners (28%) preferred the DFmod target, which used the two filters from the HarmanOE research on the 5128's DF response, followed closely by the APHarman2018Ver2 target, an OE target developed in another study focusing on preference targets on the 5128 for OE headphones. The differences between both targets do not reflect the same hypothesis of treble and bass tradeoffs, but would rather point at small band changes, mainly around the 3 kHz mark.
In a (unreleased as of writing) MOA (method of adjustment) study, listeners had three possible adjustments they could configure on the B&K 5128's DF response: ±12 dB shelf filters for bass and treble, and a +6/-10 dB peak filter at 3 kHz. Listeners were first able to tilt the response in both ways, then fine tune the bass and treble filters, and finally adjust the 3 kHz filter. Results indicate that on average, listeners preferred a -1 dB/oct. slope in the first step. Small increases in bass and decreases in treble was common in step 2, and step 3 had little changes. Cluster analysis revealed 4 different classes, all having varying levels of bass and treble preferences: the silhouette score, a measure of cohesion and separation of objects to their own and other clusters, of most of them are on the weak side due to the MOA having 3 separate variables.
HarmanIE 2019 compared to the average MOA target shows two main differences: a dip from 200-600 Hz, and more bass (with a steeper slope) and less treble above 8 kHz. The Soundguys target has slightly more bass than the average and much lower energy between 3-6 kHz than both the average target and any other tested one. The DFmod matches the closest to the average MOA target with differences in bass level and shape despite being less preferred by most listeners in listening tests compared to HarmanIE 2019 and the Soundguys target. The APHarman2018Ver2 had a significant difference in the ear canal resonance which might explain its low ratings in the preference study (only better than DF).
Notes on HarmanIE
- Bass level is based on a segmentation study by Harman, and is highly variable
- Ear gain and treble regions are heavily smoothed for various reasons. Treble also drops off heavily past 10 kHz, and probably shouldn't be considered
#
Usound1V1 target (711)
The Usound1V1 target is developed by Usound, a B2B acoustics company focusing on MEMs drivers. It uses the HarmanIE research and adds environmental noise during testing to replicate real-life portable use of IEMs in non-ideal conditions (unlike a lab). Adjustments to the base target were done similar to what Harman did, and the resulting most preferred target became UsoundV1; no papers have been published.
Differences between HarmanIE and UsoundV1 mostly come down to the bass region, with the latter having significantly more bass with the shelf starting at a higher frequency. Furthermore, the frequency range between 1 and 7 kHz is slightly reduced on the Usound target.
The differences between the HarmanIE and the Usound1V1 targets are rather minimal, although the Usound1V1 target does address a common complaint about the upper frequencies with HarmanIE.

#
Diffuse Field curve (711 & 5128)
Diffuse field is not a specific FR curve or target; rather, it is physically-defined sound field, not based on preference. A diffuse sound field admits equal weight to sound incidence from all incoming directions - imagine a very, very reverberant room - at all frequencies. By putting a HATS in such sound field and measuring the response, the resulting FR looks like what is often referred to in the community. Commonly called the DFHRTF (or simply Diffuse Field (DF) curve in most mentions), the curve will have differences depending on the HRTF of the person/HATS.
The main justification for DF equalization for headphones and IEMs is that the sound field matches how sounds are localized when wearing such devices, where most sound localization mechanisms (eg ITD and ILD) aren't "available": unlike loudspeakers or real sound sources in space, headphones and IEMs also do not have specific "angle" to measure them at like with FFHRTF measurements of loudspeakers. Another way of looking at it is by looking at the DF definition; since sound at all angles is of equal power, there is no change to the measured response no matter if the head is being rotated or displaced. Headphones and IEMs also exhibit such properties, where head rotation/displacement has no effect on the perceived sound.
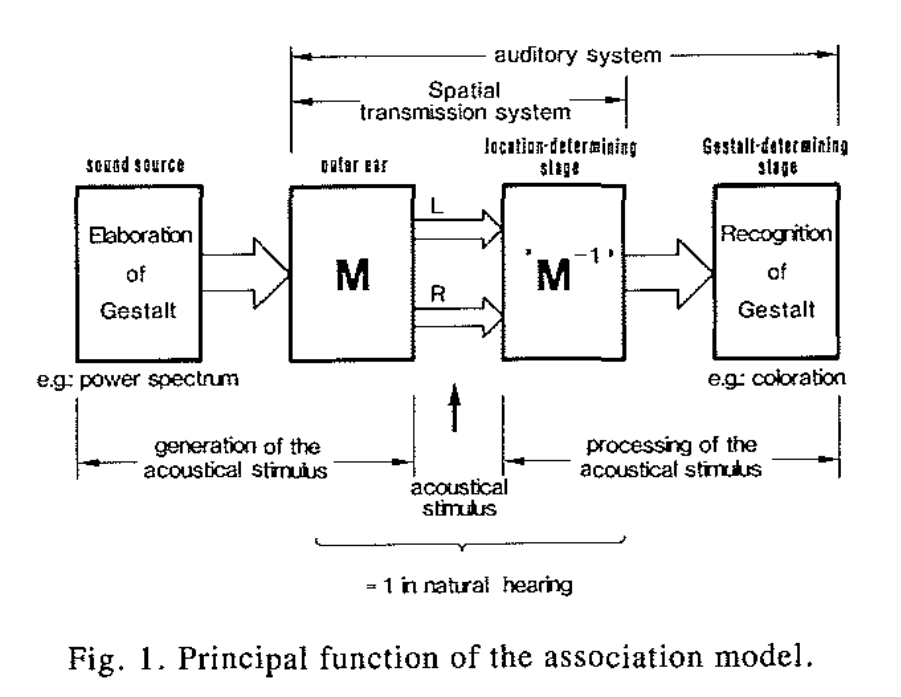
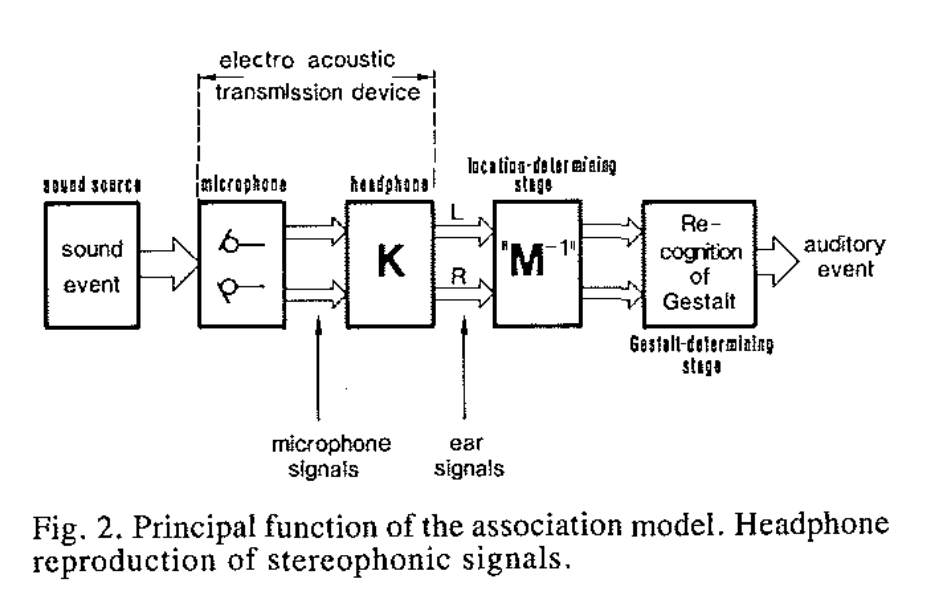
A more in-depth understanding and motivation for DF equalization can be had by inspecting Theile's association model: the premise that the brain interprets tonal response after fitting the input stimulus from two ears into its spatial response filter indicates that spectral features from the outer ear do not result in perceived timbre changes. Timbre is therefore not entirely determined by the response at the eardrum, and is instead only determined after the spectral changes resulting from the direction-dependent HRTF has been filtered out by its inverse function.
With the observation that headphones (and earphones) do not present particular spatial auditory cues to the listener, only seeming to localize from within the head, Theile concludes that headphone equalization should favor no direction (ie a DF response).
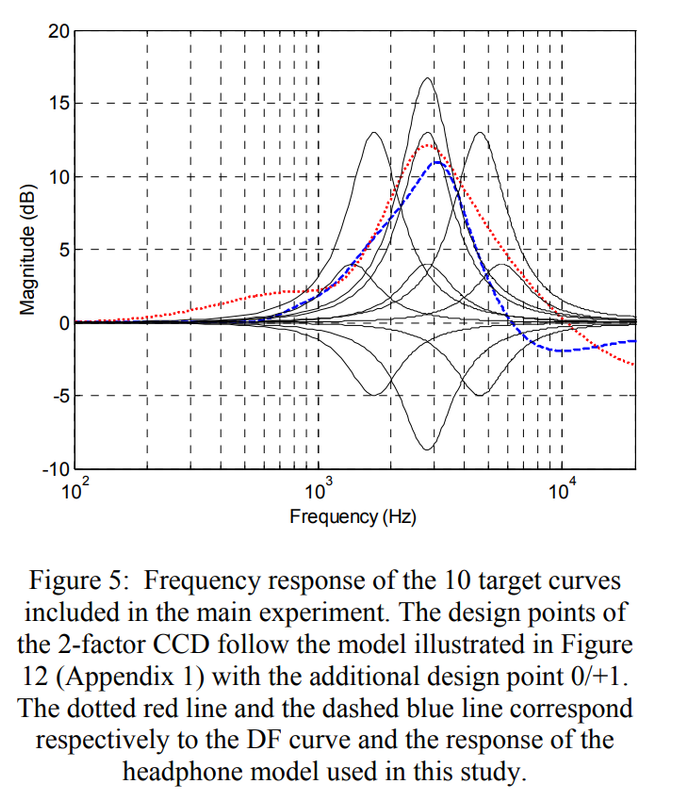
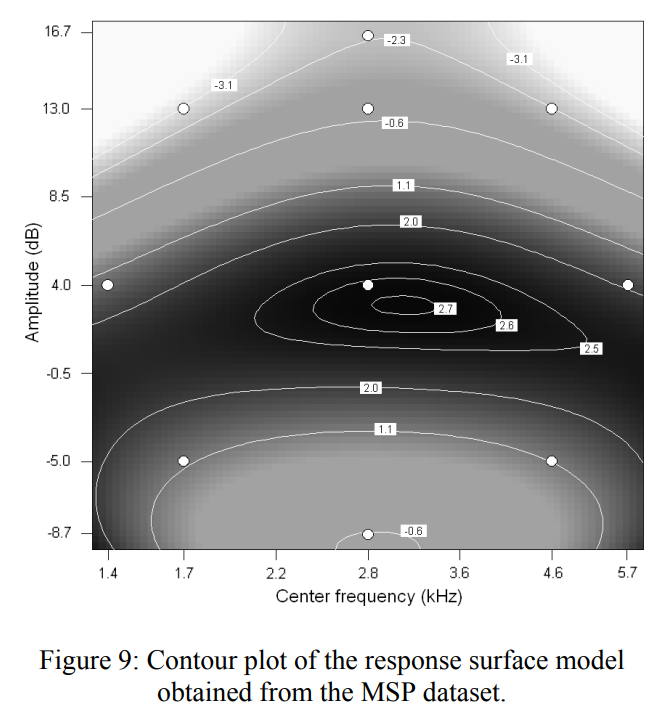
A separate study on FR curve preference was conducted by Lorho. In his 2009 paper on listener preference of curves based on FF/DF (mainly related to the 3 kHz ear gain and relevant parameters such as amplitude, center frequency, and width of the filter), it was found that the main factors to consider were the center frequency of the ear gain, as well as the amplitude. Preference was overwhelmingly determined by these factors, and curves having similar peaks as with FF and DF were disliked. Results also show that a negative amplitude was disliked. The optimal response was a 3 kHz peak with an amplitude of 3 dB (between 1 and 5 dB), which significantly lower than either responses. Although thorough, the study and its results have not been used much mainly due to the very restrictive curve modifications allowed which might result in overcompensation (eg no bass/treble modification might have resulted in a very significant deviation of the ear gain from DF). It is however important in further advocating for the use of another curve other than DF.
The ISO 11904-1/-2 standards propose two methods of measuring DF response; 11904-1 uses in-ear microphones to measure the DF response at the subject's eardrum, while 11904-2 uses a population average pinna (derived from blocked canal measurements) contributions combined with a mannequin's ear canal transfer function. The -1 standard can be thought of as an "absolute" reference, while the -2 standard can be thought of as a malleable methodology which can be applied to both the 711 and 5128 systems. For IEMs which are high acoustic impedance devices, a DF response from ISO 11904-2 is more suited, especially with 711 rigs for which acoustic impedance correction will be necessary if measurements are to be compared to a DF response obtained with the -1 standard.
It is important to note that while DF seems to fit the idea of localization with headphones/IEMs, studies have consistently shown that a "pure" DF response is not preferred or liked. Instead, it is used as a foundation for which modifications can be had. Harman's research somewhat validated this - in their recent preliminary test, additional speakers were used to obtain a reference response in their room, which correlated very much with the DF response of the same HATS - and by adding a few modifications, they have made a highly preferred curve for headphones/IEMs. Other curves built upon DF have also resulted in high preference as well. The two main modifications include bass adjustments to compensate for lack of body interaction, and overall response tilt, usually a downwards/clockwise tilt. The latter can be thought of and argued as being the same the inherent tilt of loudspeakers in a room: much like how loudspeakers should have a flat response in an anechoic sound field with a downwards tilt when placed in a room, headphones/IEMs should also have a flat response in their sound field (in this case DF) with a similar downwards tilt when listening to them.
Notes on DF
- DF seems to be the appropriate sound field when considering headphones/IEMs and the localization process from the association model
- Raw/pure DF is not preferred or liked, and should only be used with modifications
#
Etymotic target (711)
The Etymotic target, developed by Etymotic, uses the DF curve as a base and applies what Etymotic considered to be the correct room curve: the THX/X-curve, which has been shown to be not ideal in terms of preference, and is only used in theatres and cinemas as opposed to normal listening environments. The curve is based on outdated thoughts of loudspeaker radiation and concepts of accuracy. Etymotic therefore arrived at a target that closely matched their KEMAR DFHRTF (smoothed), with a reduction in energy starting from 2 kHz to 20 kHz. Another issue with the target is that it relies heavily on the accuracy score - Etymotic boasted about their 100% accuracy score for their IEMs using a slightly modified KEMAR system - as justification for its effectiveness, which is a scoring system used by Consumers Union from the 1970s until 2006. It uses what is now considered an outdated method of quantifying "correctness"/preference ratings for loudspeakers.

#
IEF 2020/2023 targets (711)
Made by Crinacle as a basic target, the 2020 target contains only a very smoothed ear gain centered at 3 kHz, and with a linear response from 20 Hz to 1 kHz. There is no formal preference testing or theoretical basis behind this target except for the ear gain concept, although the ear gain used here is not a smoothed one, but rather an oversimplification which seems to only be based on a very generic shape. Its main purpose was being a template, for which bass and treble were left to the user's preference.
The newer 2023 target based on a tilted DF response for the 5128 rigs, translated to 711 systems. The biggest difference with the DF response is that the ear gain and most HRTF features are smoothed over, akin to the ear gain in IEF 2020. Compared to IEF 2020, the major difference is an increase in low frequency energy, as well as the subtle dip at 1.5 kHz. Customization includes bass level with a shelf starting at 105 Hz, and tilting of the whole response by dB/oct.

#
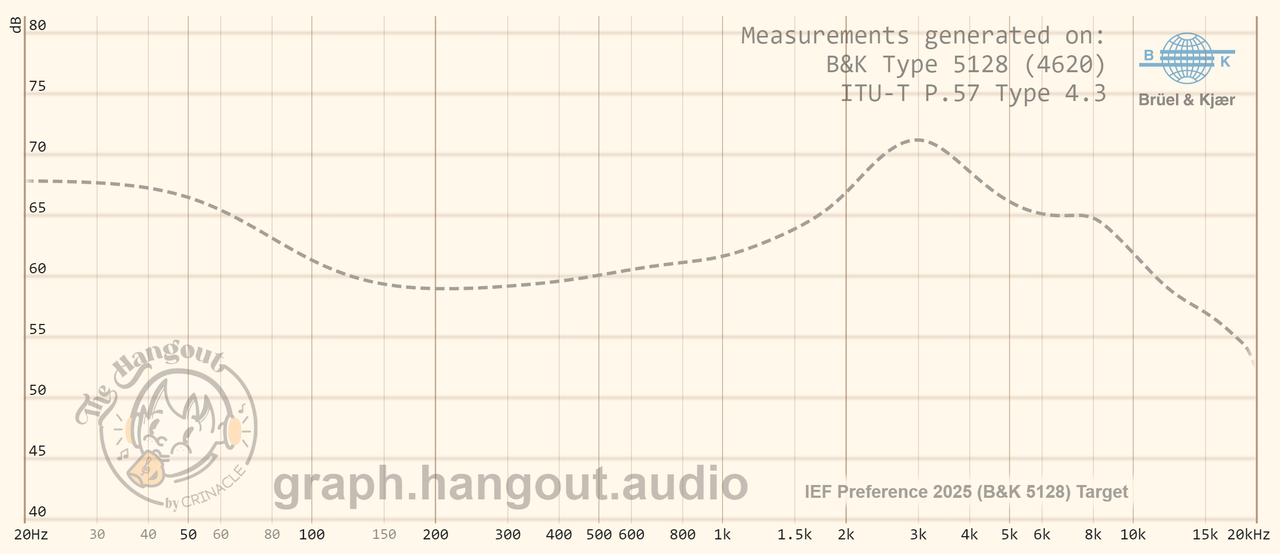
IEF 2025 Preference curve (711 & 5128)
The newest IEF 2025 Preference curve is based on the JM-1 curve, but with separate treble and bass adjustments rather than full spectrum tilts. The non-tilted JM-1 curve is modified with the following changes: a -4 dB high shelf filter with a Q of 0.4 starting at 2500 Hz (used by Harman in their preference testing), and a +10 dB low shelf filter with Q of 0.71 at 80 Hz (similar to Harman's 105 Hz filter). The target was developed for the 5128, and subsequently translated to the 711 systems using Crinacle's own IEM projects, which adhere to the curve on the 5128 but not perfectly so on the 711's JM-1 curve equivalent with the same filter changes.

#
Δ and JM-1 curve (711 & 5128)
The Δ curve is simply the 5128 DFHRTF compensated to 711 rigs. The JM-1 curve is similar to the 5128 DFHRTF, but with a distinct difference being that instead of relying on a specific measurement rig's HRTF, it uses the canal transfer function of that specific rig, combined with the contributions from a population average pinna. It is also based on the ITU-T P.57 Type 4.3 (5128) rig, and should therefore result in a more accurate DFHRTF both in terms of canal response and outer ear response. For both curves, additional changes are recommended as mentioned previously, raw DF is not preferred in tests. The changes are usually in the form of full spectrum tilting (-10 dB tilt is the same as a -1 dB/oct tilt) in the range of -0.5 dB to -1.2 dB with a variable bass shelf, or with separate treble and bass shelves (same as Harman's).
The use of a rig's canal transfer function combined with a population average pinna response for calibration of audio systems that do not interact much with the outer ear (ie does not deform or physically touch the outer ear) has been detailed in ISO 11904-2; the JM-1 curve uses a similar idea, this time using the B&K 5128 canal instead of the one specified in IEC 60318-4. For the population average pinna, it is argued that the one specified in IEC 60318 (the one used on type 4.3 and IEC 60318-7 HATS) is not representative of the human average response, being brighter than normal. Instead, a pinna from Hammershoi and Moller is used, as detailed in the ISO standard. Evidence of HATS using the mentioned IEC 60318-7 pinna having brighter DFHRTFs has been found by Harman research, which compared rig responses to that of around 350 human subjects whose HRTFs at the blocked canal were measured in their Hyperion sphere.
Because the curve is based on the B&K 5128 which can supposedly remove the need for two separate preference targets for headphones and IEMs, JM-1 also incorporates a 3kHz adjustment similar to the one found in the HarmanOE 2018 target (a reduction of around 2.5 dB). The change made by Harman is not well defined in their studies, but was explained briefly as being preferred in informal listening sessions with trained listeners. The adjustment is a reduction in energy at that region, but should only have a minor effect on preference. Based on very preliminary research by Harman (S. Olive), the JM-1 target fared quite well as a preference target against other targets and curves. While falling short of other targets like the Soundguys and HarmanIE ones, the tested JM-1 was using the filters from HarmanOE 2015 instead of HarmanOE 2018; the latter and more preferred one is very similar to the Soundguys target and tracks closely up until 8kHz. Above that, the Soundguys target has more energy while also having a bass shelf included; since JM-1 is based on DF + tilt, preference bounds from Harman research should also be used along side the curve.
For now, JM-1 and what is specified in the ISO standard are mostly similar, and are for most circumstances interchangeable. Do note that the JM-1 target is made using a derived canal transfer function, meaning it was calculated mathematically; when the canal transfer function will be measured, another target (JM-2) will be developed.
Here's a video by the creator of JM-1 explaining the target: The New IEM Meta Explained
#
SoundGuys target (5128)
Developed and released in 2021, the SoundGuys target for headphones and IEMs was made using many 5128 measurements of what the SoundGuys team describes as being a "benchmark product, which is generally a standout product that our technical team agrees does a great job of catering to the headphone market by providing a pleasing, enjoyable sound that we can all get along with". Not much of their process is explained. The resulting target was used in a preliminary IEM preference target study by Harman, and was shown to be highly preferred by both trained and untrained listeners.
