#
Target Modification (**)
Assuming that you're now familiar with EQ, it's time to dive a bit deeper into personal preferences. One good starting point is with targets, which have been tested and shown to be preferred by people. However, it has also been shown that while people do like specific targets, many also prefer some deviations from these.
There have been several targets and FR curves that have been developed throughout the years, some with more validity and rigorous testing than others. For the sake of brevity, only popular and popular targets will be discussed here, but more can be found in the Rigs, Curves, & Targets section. There are currently two targets that are used and recognized widely: the Harman In-ear Target, and the JM-1 Curve.
There are a few modifications that are worth trying out as studies have shown that listeners like varying levels of bass and treble. Furthermore,
#
HarmanIE 2019v2
The HarmanIE 2019v2 target is often used to gauge preference for IEMs, and its history and conception is covered in detail in the Rigs, Curves, & Targets section. While it is consistently rated very highly in preference testing, some resistance and criticism of the target have been present for as long as the target has been around. There are mainly two complaints about the target that exacerbate one another, and a minor one.
Common criticisms of HarmanIE 2019v2
- The dip in the region around 200 Hz removes too much bass and warmth from the FR, leading to a thin sound
- The ear gain region from 3 to 8 kHz is too elevated, leading to a shouty and overly bright sound
- The treble dives down past 13 kHz
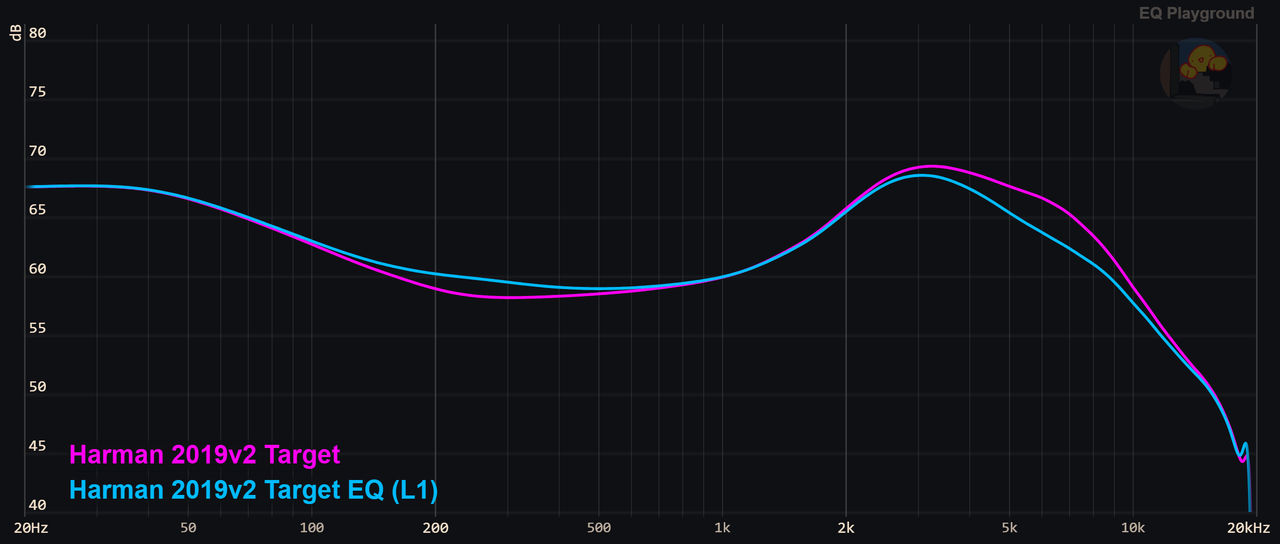
Knowing these issues, the following filters were added. The left ones are for preference adjustments for bass and treble, while the right ones address the first two criticisms. Experiment and play around with the different frequency and Q factor values. An example of a modified HarmanIE 2019v2 target is shown below.
#
JM-1
The JM-1 curve is covered extensively in the links provided above, and is a new curve that has gained popularity. It is much more different than HarmanIE 2019v2, and also performs well in newer preference testing. The JM-1 curve is unique because it is meant to be used with 5128 measurements (it can also be used on 711 measurements provided there is a compensation for a database; more details are covered in the Rigs, Curves, & Targets section).
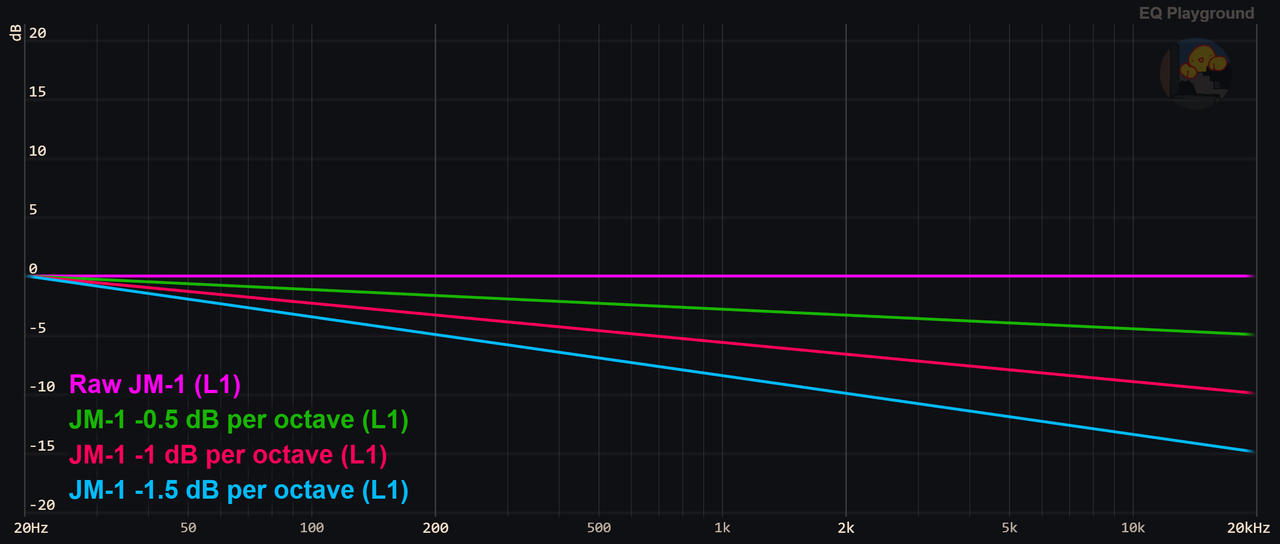
It is also usually meant to be used with a tilt, usually in the clockwise direction, resulting in a curve that has higher amplitude bass and lower amplitude treble. The tilt value is usually between -0.5 to -1.5 dB/oct; from 20 Hz to 20 kHz, there are 10 octaves, therefore a tilt of -1 dB/oct means that there is a 10 dB drop from 20 Hz to 20 kHz. The first image below contains the JM-1 (for 711) FR curves with varying levels of tilt, and the second image contains the same curves but compensated to the raw (no tilt) JM-1 curve and normalized at 20 Hz.

Like the Harman target, there are also complaints about this one although more inconsistent due to the varying levels of tilt.
Common criticisms of JM-1
- The treble and bass regions are too subdued, leading to a "boring" sound
- The lack of treble in the 3-8 kHz region is too little, leading to an overly dark and "undetailed" sound
Testing out different values of tilt is possible through compatible squig.link databases by changing the value of the curve and using EQ to match it. However, the need for separate presets for each tilt value can be tedious to create and test. The following steps can be used in conjunction with the first two left filters to adjust the tilt quickly.
- Match the IEM's FR to raw JM-1 (no tilt)
1.1. *The last left filter can instead be used for the same purpose as the steps below; simply adjust the gain (negative for clockwise tilt) to preference. The following steps are not necessary if this one is used. - For any specific value of tilt, find the change in dB from 20 Hz to 20 kHz by multiplying said value by 10 (eg -0.8 dB/oct = -8dB from 20 Hz to 20 kHz)
- Divide the value in half; the obtained value will be the gains used for the two filters (eg 8 dB gives 4 dB)
- In the low frequency filter, input the obtained value (eg 4 dB)
4.1. For a counter clockwise tilt (brighter), input the obtained value as a negative (eg -4 dB) - In the high frequency filter, input the obtained value with a negative sign (eg -4 dB)
5.1. For a counter clockwise tilt (brighter), input the obtained value as a positive (eg +4 dB)
The right ones address the criticisms which are also closely related to preference adjustments Experiment and play around with the different frequency and Q factor values.