#
Audio & EQ basics
#
Everything you need to know
A quick summary of important aspects is shown below; each aspect is also covered in more detail and depth after the summary (highly recommended to read if the information doesn't seem too daunting).
- Most important measurement is frequency response (FR)
- X axis: Frequency from 20 Hz to 20000 Hz (or 20 kHz). Low frequencies = bass, high frequencies = treble (eg whistling), in between = mid range.
- Y axis: Loudness in decibels (dB). The higher something is, the louder it will be.
- Targets are FRs that aim to sound good, and for which manufacturers try to tune their IEMs to
- In most cases, they should have a bump of 3-12 dB in the 2-5 kHz range
- Bass and treble is often variable, depending on the listener's preferences
- Unreliable and easily confused
- Several mechanisms that can affect perception in subtle ways
- EQ uses filters, each one capable of modifying the FR
- EQ is reversible
- There are several filter parameters that change how the filter impacts the FR
- A preamp with negative dB is required
- For EQ software, find a parametric EQ (PEQ). Some can be found here
- For measurements, refer to the Measurement Databases section
#
Recommended articles and videos
While not necessary to the guide, the readings from Dale's Music Stuff from HE1 up to HE7 are good, easy-to-digest yet in-depth articles that explain a lot of concepts and ideas that are immediately relevant to the task. It is focused on headphones, but the same general rules and suggestions also apply to IEMs. Reading them will provide much more information than what is given here in terms of audio and the hobby as a whole, while this guide is for the most part solely dedicated to EQ. Crinacle's Graphs 101: How to Read Headphone Measurements is also an interesting read that dives into measurements and how to read them.
The following videos are also fun and intuitive ways of understanding audio and EQ.
How Audio Illusions Trick Our Brains
Every sound is SINE
How to TUNE your headphones (the easy way!)
EQ Basics - Watch BEFORE you get started!
The Limits of EQ - A case against using EQ profiles for headphones
Before continuing, knowing how to read graphs is a crucial skill, and it is essential in using EQ. Knowing how to properly wear IEMs is just as important; getting a proper seal and consistent insertion depth will yield the best results.
The FAQ and terminology sections are also worth taking a quick look at.
#
Measurements and warnings
Measurements in the headphone and IEM community often refer to frequency (magnitude) response (FR) plots where the x-axis represents frequency, in this case the audible spectrum band (20 Hz to 20 000 Hz or 20 kHz) in logarithmic scale to match how human hearing work. The y-axis represents amplitude/loudness/SPL, usually in dB, in linear scale. Together, they form a graph that shows how loud something is at specific frequencies. An important thing to always check is the scale of each axis; these are commonly modified to skew perception. These measurements are important for two reasons.
Importance of measurements
- FR is by far the most important factor when it comes to sound quality (ignoring factors like comfort, price bias, aesthetics, etc.) and is the main metric that is used both in the audiophile hobby and the acoustic preference research sphere
- Human hearing is not reliable. There are many pitfalls and flaws in our hearing, so it is usually recommended to use graphs and measurements as a foundation. It allows for efficient detection of flaws, and it also gives a visual aspect to latch on to
Do note that music can also be represented in such plots, where different frequencies will have different amplitudes. For example, imagine a song where there is only bass music playing, and another that only has a flute: the bass song will have higher amplitudes at lower frequencies, while the flute song will have higher amplitudes at higher frequencies. Of course, music has a time component, meaning that a singular FR graph of music only represents a snapshot of the music at a specific time. Intuitively, one might assume that IEMs also have a time component; this is covered in the FAQ. All that is important for now is that an IEM's FR is all that really matters when it comes to objective metrics.

IEM measurements are significantly more prominent than others because they are devices that are easy to measure compared to headphones and loudspeakers. Further more, the prevalence of affordable clone couplers - coupler in this case referring to the measurement device - made it so that IEM measurements have become widespread in a very short amount of time while still somewhat adhering to the established standard for measuring such devices. This widespread prevalence of high quality measurements is very useful for EQ purposes as well as for getting a rough idea of how an IEM will sound like.
This does not mean that measurements are infallible. Clone couplers are manufactured by unknown companies/groups in dubious conditions, and while they might comply with the relevant standards, they are not nearly as precise and/or as consistent as official gear. Not only that, measurements might not match what the user/listener is hearing. This topic is addressed later; for now, note that having a proper seal is important for bass frequencies. It is therefore important to understand the following rules in order to avoid problems with regards to FR graphs and measurements.
Rules to consider
- Measurements between different databases/couplers/standards cannot be mixed
- Most couplers are only rated to 10kHz, therefore measurements should not be scrutinized >10kHz. High amplitude and narrow peaks/dips above 5kHz should also be ignored
- Unit variation is a considerable factor, and should be accounted for
- Most couplers have a better seal with IEMs than IEMs with human ears, so proper fit/seal should be accounted for
- Normalization should be accounted for, and should be modified to fit actual perception
Another aspect that should considered is compensation, which is used in two ways in the community. The first one uses compensation as a way to more easily see the error/deviation of an FR curve to another. Compensation in this manner improves "readability", and makes the EQ process easier.
The second way aims to correct/remove the errors introduced by the coupler. It can also be used to correct the coupler to a reference coupler, which can theoretically mean that measurements done on different couplers can be exchanged, provided they have been compensated properly. A full explanation of proper coupler compensation is beyond the scope of this guide; just know that it is complicated and requires a lot of data to work properly.
The 5128∆ project aims to create such compensations for various different databases on squig.link; more precisely, the compensations use Crinacle's coupler as a reference (more information about databases in the Measurement databases and tools section). Therefore, compensated measurements in databases that are a part of the 5128∆ project can be compared to those in Crinacle's database, and by extension to other 5128∆-compliant squig databases as well.
#
Targets and preferences
While a lot of research in terms of sound preference has been done on loudspeakers and headphones, what has been done with IEMs has been less thorough. To better understand measurements, it is important to understand the intersectionality between preference, perceived accuracy, and anatomy.
Oversimplified summary on the role of anatomy in terms of hearing and graphs
- Parts of the ear/body act like filters on the incoming audio signal for localization purposes. The biggest change is a total rise from 1.5kHz - 8kHz peaking at 3kHz
- The eardrum acts like a pressure detector measuring amplitude vs frequency. Therefore, the eardrum does perceive more 3kHz energy
- The brain expects these changes, and "cancels" out these filters. The resulting perceived sound is therefore the same as the original sound
- IEMs bypass many of those parts. They should therefore aim to have a resulting sound at the eardrum that includes every single expected changes
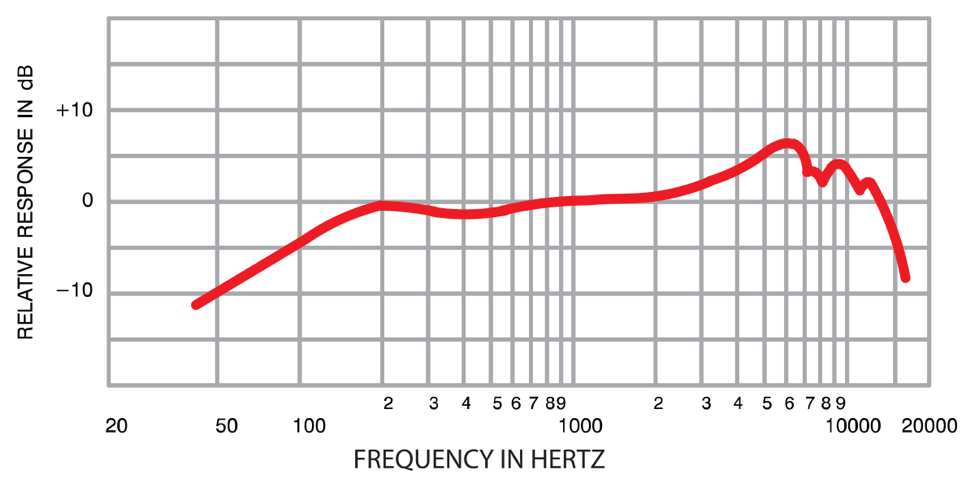
Grasping the above is important because it explains why IEM measurements and preference targets are not flat, and why they have a large rise after 1kHz (commonly referred to as ear gain). The couplers used for measurements aim to simulate the eardrum where resulting measurement will reflect the FR at the eardrum after having been influenced by parts of the body. These changes that the brain expects are called Head-Related Transfer Functions (HRTF), and it is this HRTF that is responsible for sound localization. Of course, different people will have different HRTFs due to differences in anatomy, and these differences become significant in certain frequency ranges. While HRTF variation is quite high, there is still value in trying to find a preference target that sounds pleasing to the majority of people, which is why preference research is still ongoing. The image below is commonly used to explain HRTF; only the concept of the rise and fall of the FR should be noted, as all the other minutiae is not applicable to IEMs/headphones.

Oversimplified summary on preference research
- There is a significant correlation between preference and "neutrality"/accuracy in terms of sound reproduction
- For loudspeakers, this means that a flat FR in anechoic conditions is preferable
- Anechoic conditions are rarely found in everyday life, much less in studios. Most environments are semi-reflective, which introduces a downwards slope (or clockwise tilt) to the loudspeaker FR
- IEM (and headphone) preference research usually aims to recreate similar timbre to that of optimal loudspeakers
- Significant deviations in bass and treble is normal, and attributable to preference, hearing loss, and other factors
- Small changes in FR (<3dB) over relatively small frequency ranges are hard to notice at best, and imperceivable at worst
The most "researched" target comes from Harman, and the latest iteration of their IEM target is their Harman In-ear (HarmanIE) 2019v2 target. Despite being the most thoroughly researched target, there has been a lot of pushback against this target. Furthermore, many prominent reviewers have also included their own personal preference targets in their databases. Oftentimes these targets are either existing preference targets with tweaks (eg some variation on HarmanIE) or a mix of different FR parts of different IEMs they like (eg combining the bass of X IEM, mid range of Y IEM, and treble of Z IEM).
The following is a brief summary of important preference target curves, as well as other curves that are not based on preference. There are also more informative and in-depth explanations of each of them in the Rigs, Curves, & Targets section.
Summary on various preference targets and other curves
- Harman In-Ear (HarmanIE): Preference target by Harman for IEMs, based on past headphone and loudspeaker preference studies. The most validated target when it comes to targets with proper listening testing
- Diffuse Field (DF): FR curve based on a completely "reverberant" listening condition (ie no energy emphasis on any direction). Used mainly as a reference curve, not a preference one
- Etymotic Target: DF with an introduced "room tilt" based on outdated preference research (Consumer reports accuracy score) and the X-curve.
- IEF 2020: Rudimentary target, mostly used to showcase "proper" HRTF features / ear gain. Bass is completely variable and up to taste, but is shown as flat for ease of use
- IEF 2023: Target based on DF + tilt for IEC 60318-4 compliant rigs. Bass is also completely variable and up to taste
- DF + tilt (Δ and JM-1): Popularized by the Headphone show and Crinacle. Essentially a DF curve with varying levels of tilt across the whole response. Used with preference bounds from Harman research, so there's not a singular target. Mostly used in the context of the B&K 5128 rig
#
Human hearing
The human hearing mechanism is complex, and can only be summarized in an almost-vulgar, oversimplified manner. A few more of the relevant concepts to this guide are discussed.
Human Hearing is unreliable and flawed
Human hearing is deceptively flawed and unreliable, whether it be due to sensory filtering or short auditory memory. This is not to say that human hearing should not be used throughout the EQ process (in fact it should be as EQ is used to shape the IEM's sound to your preference), but rather that it is subject to many traps in such a way that it cannot be used to describe what is actually happening in the IEM on a physical measurable way.
Auditory masking
Auditory masking is a phenomena where a signal can affect the perception of another signal, usually one in proximity in terms of frequency. The following image illustrate the concept: a simple tone at one frequency (masker) can create a masking threshold on the surrounding frequency range whose shape and amplitude depends on the masker's own loudness. Any other signal that falls "under" the threshold is masked and inaudible.

Auditory memory
Auditory memory is especially fragile and short for humans. Relying entirely on memory when it comes to sound is not possible. It is therefore recommended to take notes of sound impressions, do ABX tests, and use measurements when it comes to describing and/or modifying IEMs and audio. It doesn't mean that our hearing is useless, but rather that it is very fickle and should be used as a "measuring tool" conservatively.
Equal-Loudness Contours
Equal-loudness contours show the required loudness level (in this case phons) for perceived equal loudness at various frequencies. The image below shows a rise in lower and higher frequencies in the curve, indicating that those regions need more phons in order to be perceived the same as the middle frequencies (ie human hearing is more sensitive to the middle frequency range). Another important aspect is how this rise in low/high frequencies reduces as SPL goes up, indicating that those regions require less phons in order to be perceived in equal loudness (ie human hearing becomes more sensitive to low/high frequency range with increases in listening volume). The effect over normal listening volumes is somewhat negligible, but it should still be considered throughout the guide.<-

Distortion and audibility
Distortion at a frequency increases/decreases when the amplitude at said frequency increases/decreases. Therefore, using EQ to boost the level of certain frequencies will also increase distortion. For IEMs, distortion is negligible, and even more so when considering distortion audibility with music. Only severe flaws with the IEM will lead to distortion being a relevant metric to consider.
Brain Burn-in
Brain burn-in refers to how our perception of sound can change with time as we get acclimated to a particular sound, and often occurs (in the context of IEMs) when the FR of a new IEM is significantly different than another one that was used before it. Preference for the new one is then taken to the extreme (positively or negatively), and this disparity in preference averages out and lessens with time as the user gets used to the sound presentation. For this guide where comparisons and constant subjective evaluation are needed, brain burn-in should be isolated and/or removed from the process.
#
Equalizer basics
An equalizer (EQ) is a tool used to modify a signal, in this case an audio signal. In most cases, it is used as a way to change the amplitude for a specific frequency range/band, through the use of filters, each of which can change the FR.
Four relevant filter parameters
- Filter frequency, which dictates where the center of the filter is
- Filter quality/slope Q, which dictates what frequency range will be affected by the filter
- Filter gain, which dictates the amplitude change, usually in dB
- Filter type, which dictates how a filter behaves
There are different types of EQs, ranging from analog/digital EQs to parametric and graphic ones. Parametric EQs (PEQ) allow the user to change all three parameters, and provide a nice balance between being flexible, and being easy to modify and use. Unless stated otherwise, EQ will refer to PEQ for the rest of the guide.
EQ minimalism
The guide adheres to what I call EQ minimalism, which can be thought of as an approach to how EQ is used and developed: ideally, an EQ preset should have as few filters as possible, and each filter should have low gain and Q values. Aiming for few but broad changes is a good rule of thumb to follow; for more complex sections, deviation from this rule will be normal, even necessary.
The following image shows three FRs in three different colors. The red one is the base one with no filters, while the green and blue ones have different filters in order to showcase what each parameter does. The table includes the filters used in increasing order of frequency; the three left columns are for the blue FR, the three right columns for the green one.

A few things to note
- Increasing gain also widens the filter
- Overlapping filters are summed. For the last two filters for the blue FR, the gain is 5 dB, but the overlap make the peaks land at around 7 dB
- Negative gain is also possible. If two filters with the same frequency and Q values have "opposite" gain (eg 4 and -4 dB), they will be canceled
The only parameter that was not discussed is the filter type. In this guide, three types are used the most often.
Filter types
- Peak filters, which are the ones shown above
- Low-shelf filters, which boosts every frequency below the specified one (first row). The Q changes the shape of the filter
- High-shelf filters, which boosts every frequency above the specified one (second row). The Q changes the shape of the filter

Shelf filters are useful for large changes for which precision is not needed, and are often used for customizing preference targets. For example, if the HarmanIE 2019 target sounded too bassy, simply adding a bass shelf filter with negative gain can be a simple yet effective fix. Same thing for treble: if there is too much or too little of it, use a high shelf filter to change the whole range. Shelf filters are generally used only for the two ends of the frequency range because of their nature, with Q values of 0.5, 0.71, or 1. More will be covered in relevant sections.
When using EQ, there is also preamplification that has to be taken into account. In the digital domain - computer, phone, etc - volume has an upper limit. Exceeding this limit results in digital clipping, which can happen when an EQ preset has large boosts. To avoid this, a preamp is used which reduces the digital volume. Preamp values should always be negative dB values, and should correspond to the highest amplitude change of the EQ preset. For example, taking the blue FR in the first image with peak filters, the preamp would have to be -10 dB. If only the last two filters are considered, then the preamp would have to be -7 dB; the preamp does not necessarily correspond to the highest gain value of a filter, but rather the highest gain value overall, since summed filters can result in larger amplitudes/gain.
#
Tools and software
Now that the basics are done with, here is what's needed for using EQ.
#
EQ App
The link is useful for finding what EQ software is best for a specific OS or device. Do note that these are options that are compatible with AutoEQ; there are other software/hardware that also do EQ, such as VST plugins and more, but they might have different ways of calculating filter slopes.
Do note that because of how the Android audio stack works, there are slight differences in how different apps implement their EQ.
For the rest of the guide, EqualizerAPO with the PeaceGUI will be used; differences between different apps that have PEQ are very minor. Depending on the complexity of how EQ is being used, additional software and tools might be required.
EqualizerAPO/PeaceGUI filter types
It is important to choose the appropriate filter types when using EQ. The image below contains the main ones; the difference between the shelf filters is that the one with "Q as slope" has adjustable Q values, while the one without has a default Q value of 0.707. Any other app not in the link above might have different filter types with different filter slope derivations that will not match what this guide uses (Robert Bristow-Johnson cookbook).

#
Measurement databases and tools
For IEMs specifically, the most comprehensive database is a collection of individual databases (commonly referred to as squigs) all under the squig.link group. While it does contain the most measurements out of any other database, measurement quality can vary between different individual databases, and each individual might not have the same measurements as others. It also has many features such as an in-built Equalizer that provides immediate visual feedback, measurement importing, and more. There are instructions and explanations when clicking on the yellow question marks, one for navigation and the other for the 5128∆ project.
squig.link
Other noteworthy databases can be found in the Measurement Databases.